How Does The MIL-VAX Agency Detect GBS?
What were the troop incidence rates of Guillain-Barré Syndrome (GBS) during November 1, 2009-April 30, 2010 the A/H1N1 Vaccination Campaign

This paper is motivated by:
the Predictive Value of Surveillance Case Definitions of Guillain-Barré Syndrome in Vaccine Safety Assessment published in the MSMR Vol. 19 No. 3 March 2012; and
the lessons learned from the 1976 Swine Flu (Influenza A/New Jersey) Vaccination Campaign Case study described in my recent article An uncontrollable system.
The first lesson learned is that the CDC’s passive safety monitoring systems such as the current VAERS system typically underreport cases of vaccine injury. The second observation is that even with active surveillance as detailed in Guillain-Barre Syndrome Following Vaccination in the National Influenza Immunization Program, United States, 1976-1977, Schonberger, et. all. American Journal of Epidemiology Vol. 110, No. 2 1979, the CDC may still have underreported cases by nine times. However, active surveillance systems do exists for our military whose health is tracked in a database known as DMED and occasionally we can get a glimpse of what they know from monthly publications issued by the Armed Forces Health Surveillance Center known as Medical Surveillance Monthly Reports (MSMR)s.
How Many Adult Americans were Spared developing GBS following The ‘76 Swine Flu Vaccine?
Motivation for active surveillance is detailed by Schonberger as follows:
By December 2, when over 35 million doses of vaccine had been administered, two clusters of Guillain-Barre syndrome (GBS) in recent recipients of the vaccine were reported to the Center for Disease Control (CDC) from two states: Minnesota (four cases) and Alabama (three cases). As a result of identification of these two clusters, CDC, with the cooperation of several state health departments, initiated an epidemiologic investigation to evaluate the possibility of a relationship between GBS and vaccination with the A/New Jersey influenza vaccine. By December 15, preliminary data from Alabama, New Jersey, Minnesota, and Colorado suggested that the incidence of GBS among vaccinees was approximately seven-fold greater than the incidence among those who had not received vaccine (1).
and the dates the active surveillance began
An active surveillance system for reporting of GBS cases with onset during the study period, October 1, 1976-January 31, 1977, was established in cooperation with state and local health authorities. This surveillance system was initiated in 11 arbitrarily selected states during the period December 3-16, 1976, and subsequently expanded to include the 39 remaining states, Puerto Rico, and District of Columbia on December 17.
When the epidemiologists saw this plot resulting from their active surveillance, they knew immediately that the Swine Flu vaccine was harming more Americans than was expected.
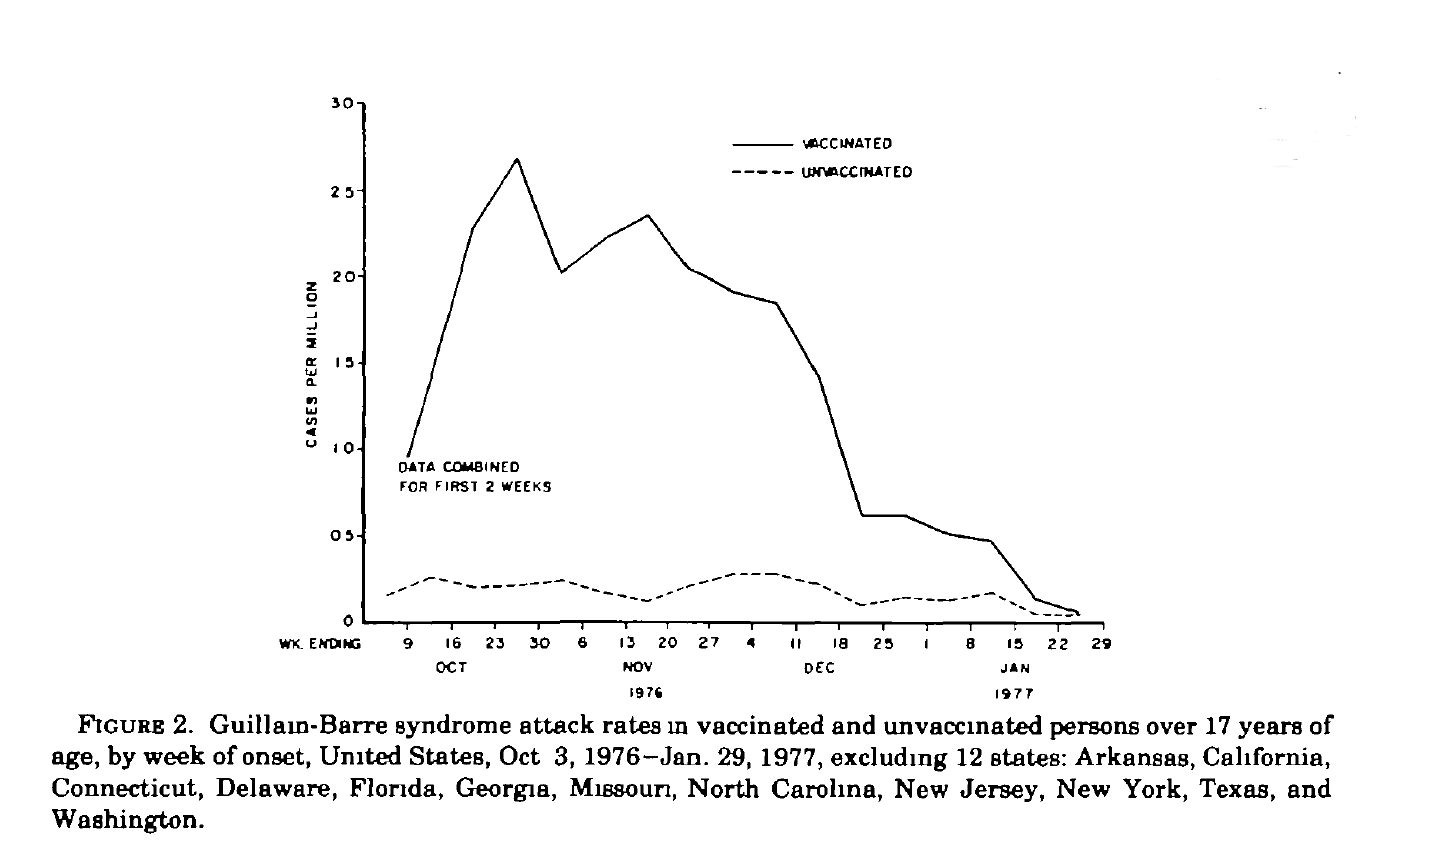
This is why it is important to have a large population of vaccinated and unvaccinated adults in order to generate these types of findings. In the abstract, Schonberger, teaches us that the results of this study allowed them to conclude that GBS occurred at a rate of one case for every one hundred thousand vaccinations. We can verify this as detailed in Table 1.
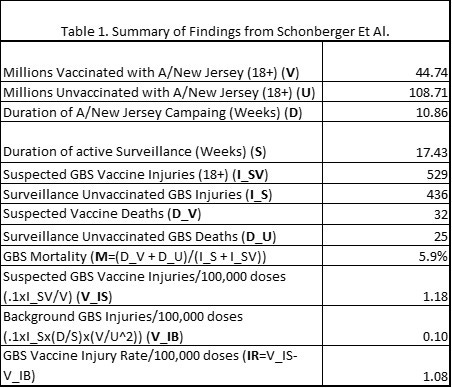
In table 1 we learn from the CDC’s active surveillance data:
5.9% of American adults 18 and older (18+) die from GBS which included 32 who died after receiving the Swine Flu vaccine.
An observed incidence of (0.1x529/44.74) 1.18 adults per 100,000 doses developed GBS following vaccination.
The background rate of GBS was estimated to be 1 adult per 1,000,000 doses
As a result, 1.18-0.1=1.08 adults (18+) developed GBS for every 100,000 doses administered.
Finally, thanks to the investigative report by Mike Wallace we can see how the CDC’s active surveillance system still failed to detect all GBS cases which resulted in an underreporting factor of (4,528/483) 9.4 (we first reduced Mike Wallace’s 300 reported deaths to 300x(29/32) to 278 then divided 278 by .059 to estimate 4,528 cases). In Table 2 we list the numbers of those requiring mechanical respiratory assistance with the formula number of cases (No) divided by four (No/4). We note that Schonberger observed that 24.7% of the background cases required ventilation while 20.3% of the suspected vaccinated cases required mechanical ventilation; however, for simplicity of comparison we use the expected rate that 25% of GBS victims will require ventilation.
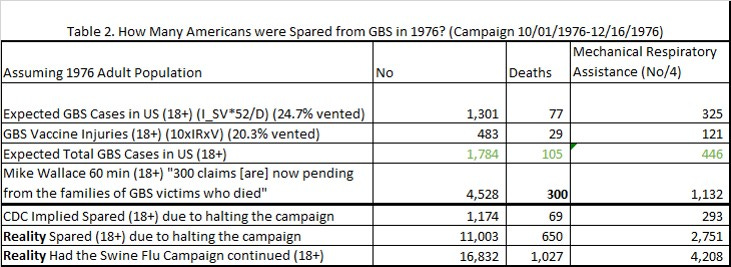
Implicitly, by the CDC’s own numbers resulting from their active surveillance, and Mike Wallaces’ reporting we learn if they did not halt the 1976 Swine Flu campaign then up to 4,528x(1+(108.71/44.74)) + 1,301 = 16,832 adults may have developed GBS in which 1,027 may have died with 4,208 on ventilators. At least 69 lives were saved and potentially up to 650 lives were saved by halting the program for adults. Thankfully, few children were vaccinated by the time it was halted.
Predictive Value of Surveillance Case Definitions of Guillain-Barré Syndrome in Vaccine Safety Assessment [3]
In p. 8-9 MSMR Vol. 19 No. 3 March 2012 publication [3] we learn the following:
Guillain-Barré Syndrome (GBS) is the most common cause of acute neuromuscular paralysis in the world. It is characterized clinically by acute, progressive, and generally ascending muscle weakness, loss of deep tendon reflexes, and paralysis. A recent systematic review estimated baseline incidence rates to be 1.2 cases per 100,000 person-years.
This is consistent with what Schonberger observed for unvaccinated adults in which he found 436 unvaccinated cases over a 17.43-week period which results in 436x(52/17.43)x(108.71+44.74)/108.71 = 1,836 cases per year, (183.6/153.45) = 1.2 cases per 100,000 person-years (18+). The background rate for (< 18 years) is lower and can be derived from the Schonberger paper in which 120 of the 64.115 million under 18 years of age developed GBS during the 17.43 period resulting in a background rate of 120x(52/17.43) = 358 cases per year, (35.8/64.115) = 0.55 cases per 100,000 person-years. Observe that adults in 1976 developed GBS at a rate (1.2/0.55) 2.2 times more often than non-adults, 17 years and younger. Next, we learn the following:
Surveillance for GBS was heightened during the 2009-2010 pandemic influenza A/H1N1 vaccination campaign. Immunization against both seasonal and pandemic H1N1 influenza strains is mandatory for uniformed members of the U.S. military. Safety monitoring of this program, including the monitoring of adverse events after vaccination, has been coordinated through the Armed Forces Health Surveillance Center (AFHSC) and the Military Vaccine Agency (MILVAX).
And they reported on sixty-one service members were identified as possible GBS cases which after “detailed reviews of the medical records of the possible cases by MILVAX, 25 (41%) of the possible cases were confirmed as true cases”. Meaning that 36 of the reported cases were most likely classified as “other neurological“ injuries. The paper then goes on to show that instead of “using a standardized medical chart abstraction form based on the Brighton Collaboration case definition” they can simply eliminate 29 of the suspected cases by simply counting those cases in which the soldier was hospitalized with the GBS diagnostic code (ICD-9-CM: 357.0) in the primary position. Furthermore, they could improve their specificity to 88% and eliminate 32 suspected cases by considering one inpatient (primary position) and one outpatient encounter (primary position). But left unanswered in this article is what is the incidence rates of GBS in our troops after the A/H1N1 vaccination. In order to try to tackle this question, we need to look at their definition of the two cohorts used in the MILVAX study.
The H1N1 cohort included all individuals who served in an active component of the Army, Navy, Air Force or Marine Corps who were vaccinated against the pandemic influenza A/H1N1 strain during the 2009-2010 vaccination season (November 1, 2009-April 30, 2010).
In which the H1N1 cohort excluded those “who did not receive a seasonal influenza vaccine in the previous season”. In other words, the H1N1 cohort only considered those active military members who actively served in 2009 and 2010 in which they received the H1N1 vaccine and the previous seasonal flu vaccine (November 1, 2008-April 30, 2009).
The historical cohort included all individuals who served in an active component of the Army, Navy, Air Forces, or Marine Corps who received a seasonal influenza vaccine during November 1, 2008-April 30, 2009.
In which the historical cohort excluded those individuals who did not receive the “A/H1N1 vaccine during the 2009-2010 vaccination season” but implicitly served actively in 2008 and 2009 to have received a seasonal flu shot for the 2008-2009 vaccination season and the 2007-2008 vaccination season.
In order to estimate the total size of these two cohorts I will make the following assumptions:
The number of active troops who served in 2010, D_2010, is the sum of the number of active troops who did not retire in 2009 and the new recruits of 2010.
D_2010 = (D_2009 - R_2009) + N_2010
The number of retirees of 2009, R_2009, received the seasonal flu shot for the 2008-2009 vaccination season and the 2007-2008 vaccination season while not receiving the A/H1N1 vaccine. They are the size of the historical cohort.
The number of new recruits who served in 2010, N_2010, is the same as the number of troops who retired in 2009 (R_2009 = N_2010). The new recruits did not receive the 2008-2009 seasonal vaccine and are therefore excluded from both cohorts. This with assumption 1 implies that D_2009 = D_2010.
The size of the H1N1 cohort is, therefore (D_2010 - R_2009).
Therefore the total cohort, D_cohort, is the sum of the historical cohort and the H1N1 cohort.
D_cohort = R_2009 + (D_2010 - R_2009) = D_2010 = D_2009.
If we denote troop size in terms of millions then we can compute the incidence rate of GBS in the troops during the H1N1 pandemic vaccination campaign, I_H1R, to be
I_H1R = 0.1x”Confirmed GBS Cases”/D_cohort (2.5/D_cohort) cases per 100,000 person-years.
Recall that the background incidence rate of GBS, I_B, is 1.2 cases per 100,000 person-years. So that we can now estimate the incident rate of vaccine injuries from the H1N1 vaccine in the troops,
IR_H1N1 = (I_H1R-I_B) = 2.5/D_2010 - 1.2 cases per 100,000 vaccinations
because each member received only one H1N1 swine flu vaccination. So what was the troop size in 2010? We can estimate that from the following table in the April 2011 MSMR (Vol. 18 No. 04) [4].
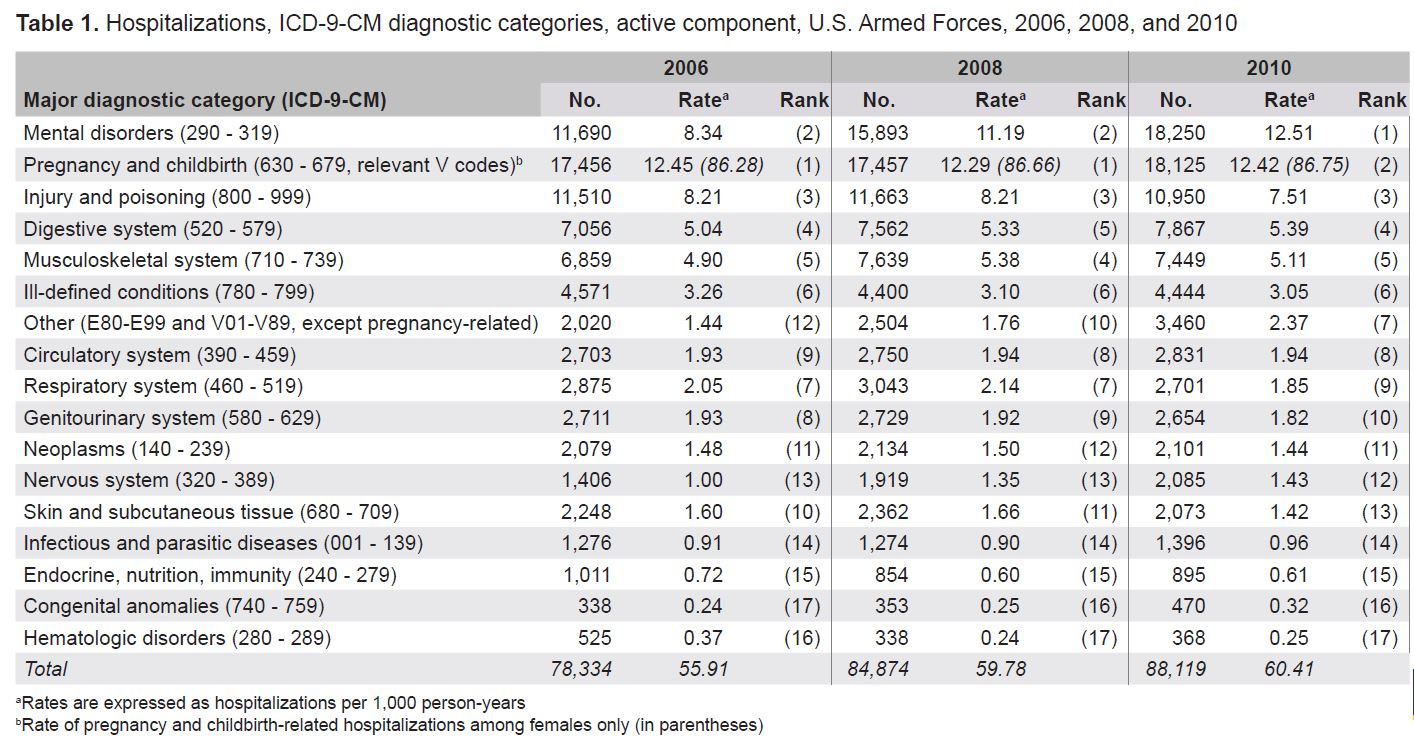
In 2010 there were 88,119 hospitalizations, H_2010, resulting in a rate of 60.41 hospitalizations per 1,000 person-years, Rh_2010 = (0.001 x H_2010/D_2010). Therefore, we can solve for the troop size of 2010 as D_2010=88.119/60.41 = 1.46 million. This allows us to solve for the rate of GBS following H1N1 vaccinations as
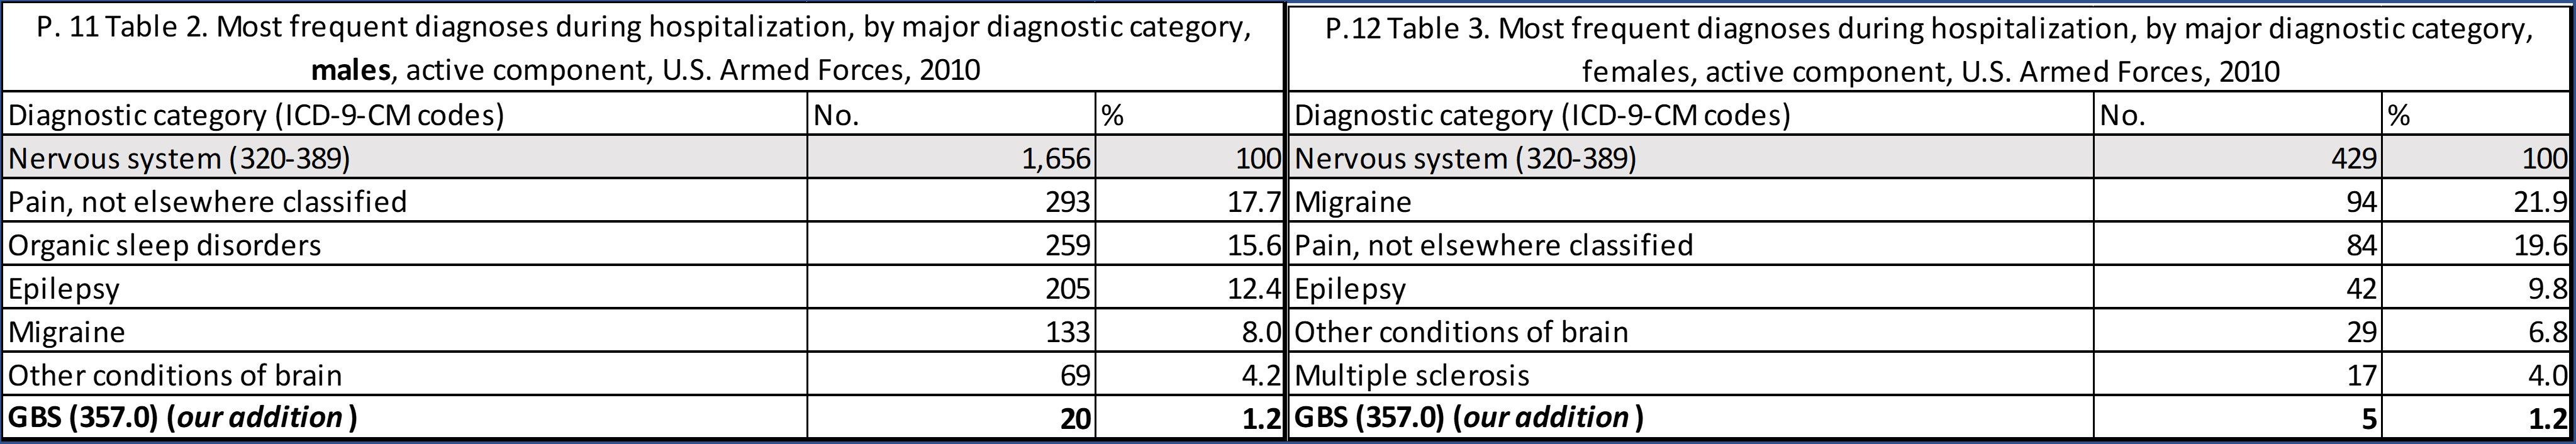
IR_H1N1 = 2.5/1.46 - 1.2 = 0.51 cases per 100,000 vaccinations (48% the published injury rate for the adults who received the Swine Flu vaccine) which would result in an additional 14.6x0.51 = 7.4, so around 7 to 8 additional cases of GBS in which the expected total would have been 18 or 19 troops hospitalized with GBS in 2010. The next question we need to answer is where would the 25 hospitalizations rank for GBS (ICD-9-CM: 357.0) in the Nervous system (320-389) for the assumed 20 men and 5 women who were hospitalized with GBS in 2010 rank? Table 4 shows that they would account for 1.2% of those hospitalized for Nervous system disorders if they were included with the 2010 troop totals.
Can we estimate how many ambulatory visits occurred for GBS injuries in 2010? First, we note the following in the April 2011 MSMR p. 21.
Also, this summary is based on first-listed (primary) diagnosis codes reported on ambulatory visit records. As a result, the summary discounts morbidity related to comorbid and complicating conditions.
We can estimate a lower bound by using Table 5 which was published on p. 9 of MSMR Vol. 19 No. 3 March 2012 and assuming that an ambulatory visit was required for hospitalization.

From “P. 9 Table 1a” we have 61 encounters with GBS as the primary diagnosis.
From “P. 9 Table 1c” we have 23 + 3 (26) (42% less) additional outpatient encounters in which GBS is the primary diagnosis.
We now have 61 + 26 = 87 ambulatory visits. We shall further assume that the 3 false positives will not return for any additional visits and the remaining 23 patients will return at a decreasing rate of 2 per visit. Which results in an additional 21+19+…+1 = 121 ambulatory visits.
Therefore, we expect around 61+26+121=208 ambulatory encounters when there are 25 soldiers hospitalized for GBS which results in an ambulatory rate of (208/25) 8.32 ambulatory visits/ hospitalization.
Validation and Implications
Recall that when a GBS injury claim is filed with the vaccine injury court and the injury occurs 3-42 days (not less than 3 days and not more than 42 days) following a seasonal influenza vaccination it is assumed that the injury was caused by the vaccine and HHS must pay the victim pain and suffering, lost wages and provide for their medical related care. For reference, this table injury is listed in row XIV, “Seasonal influenza vaccines”, in the much more limited and revised Vaccine Injury Table for all claims filed with HHS after March 21, 2017. How many Americans received the H1N1 vaccine? How many Americans did HHS implicitly admit to injuring with the H1N1 vaccine? How many injured Americans received compensation? First, we learn from Presentation: "2009 H1N1: Overview of a Pandemic, April 2009 - August 2010" on slide 2009 H1N1 Accomplishments (Part 2 of 3) that:
As of June 3, 2010, about 127 million doses of vaccine had been shipped to vaccine providers and 143 reports of Guillian-Barre syndrome (GBS) had been reported to VAERS which collected 11,180 adverse event reports of which 860 were serious.
The vaccine safety data thus far have shown that the 2009 H1N1 vaccine has a safety profile similar to seasonal influenza vaccines.
By our estimate, we would have expected around 127 million doses x 5.1 million cases of GBS per million doses, or around 648 cases of GBS instead of the 143 implicitly admitted by the CDC (HHS). Once again showing, even when the CDC tries to show that it is actively monitoring for injuries they still fall 4.5 times too short. Here is a link to the VAERS reports:
140 Case reports with “Guillain-Barre syndrome” as a symptom in 50 US States.
A cluster of 11 reports in GA jumped out in which we see the following prose in cases such as VAERS ID:648198
The following is verbatim from the article: Abstract: Background: No comparative review of Vaccine Adverse Event Reporting System (VAERS) submissions following pandemic influenza A (H1N1) 2009 and seasonal influenza vaccinations during the pandemic season among one population has been published. Methods: We compared two populations adverse event reporting rates. Adverse events (AEs) following vaccination were identified from VAERS for adults aged 17-44 years after pandemic (monovalent influenza [MIV], and seasonal (trivalent inactivated influenza [IIV3], live attenuated influenza [LAIV3]) vaccines. The first population vaccination coverage was provided by the Medical Surveillance System. The second population vaccination coverage was estimated using data from the National 2009 H1N1 Flu Survey and the Behavioral Risk Factor Surveillance System survey. Results: Vaccination coverage was more than four times higher for MIV and more than twenty times higher for LAIV3 in the first population than in the second population. The reporting rate of serious AE reports following MIV in the first population (1.19 per 100,000) was about half that reported by the second population (2.45 per 100,000). Conversely, the rate of serious AE reports following LAIV3 among the first population (1.32 per 100,000) was more than twice that of the second population. Although fewer AEs following MIV in the first population were reported overall, the rate of Guillain-Barre Syndrome (GBS) (4.01 per million) [0.41 per 100,000] was four times greater than that in the second population. (1.04 per million).
This validates our analysis, Renata J.M. Engler, MD who works with the Immunization Healthcare Branch, Defense Health Agency, reports that GBS occurred in our troops at a rate of 0.40 per 100,000 vaccinations in which he and his coauthors publish 7 cases following H1N1 vaccinations (our best case estimate was 0.51 per 100,000 vaccinations with 7 to 8 additional GBS hospitalizations). They also observed that apparently, the CDC fell (4.0/1.04) 3.9 times short of their estimate as they concluded their article with “The rate of GBS reported following MIV was [3.9 times] higher in the military.”.
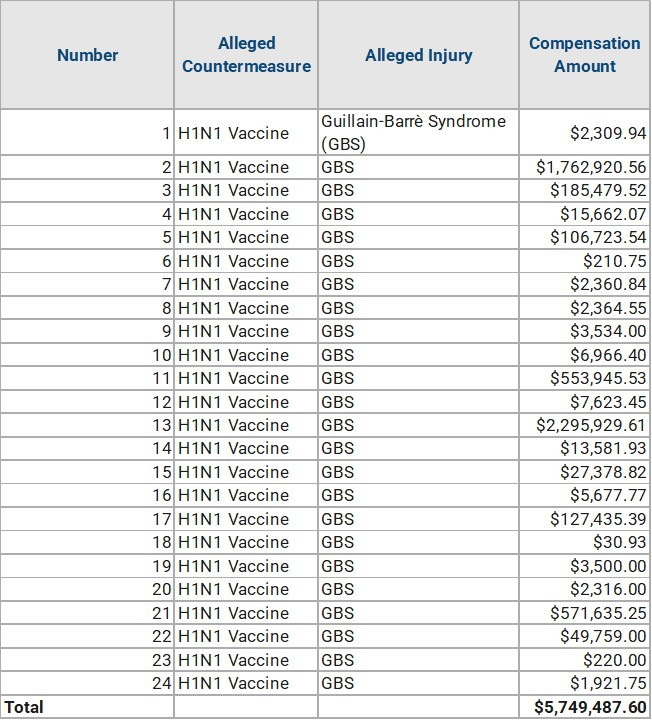
So by the CDC’s implied estimate 1.04x127 = 132 GBS cases occurred out of the 143 VAERS reported cases and due to underreporting its probably more likely that 4.0 x 127 = 508 victims of GBS were eligible for compensation from the National Vaccine Compensation Program; however, the H1N1 vaccine was issued under a EUA and victims could only file claims with the Countermeasures Injury Compensation Program which provides no reimbursement for lawyer fees, support for lost wages or pain and suffering. Only 24 Americans were compensated for a total of $5,749,487.60 (a paltry $240,000 per claim as compared to Mike Wallace reporting that injured Americans were asking for around $3.4 million dollars per claim (in 2010 inflated dollars) per 1976 Swine Flu Vaccine injury. This leaves me with a final ratio called the Injured American to Government Burden Ratio (IAGBR) it is the ratio of dollars that an injured American will have to pay for their vaccine injury to that which the government will help with. If the ratio is 1 then the government is helping all injured Americans, higher than one indicates how much of the burden lies on the victims’ shoulders. For the H1N1 vaccine that ratio is around:
IAGBR_H1N1 = (143/24)x(3.4/0.24) = 84 (on the low end) and
IAGBR_H1N1 = (508/24)x(3.4/0.24) = 300 (on the high end) which for all practical purposes saves the government from having to provide up to $1 billion dollars in aid to injured Americans.
Six years after the time to file a claim for a GBS injury had expired, on October 01, 2016, HHS updated the list of compensatable injuries for the H1N1 Vaccine to include GBS injuries if the onset interval for a first symptom or manifestation of onset of injury after administration was 3-42 days (not less than 72 hours and not more than 42 days).
References
Schonberger, L.B., Bregman, D.J., Sullivan-Bolyai, J.Z., Keenlyside, R.A., Ziegler, D.W., Retailliau, H.F., Eddins, D.L. and Bryan, J.A., 1979. Guillain-Barré syndrome following vaccination in the national influenza immunization program, United States, 1976–1977. American journal of epidemiology, 110(2), pp.105-123. URL: https://academic.oup.com/aje/article-abstract/110/2/105/57614
Bardenheier, B.H., Duderstadt, S.K., Engler, R.J. and McNeil, M.M., 2016. Adverse events following pandemic influenza A (H1N1) 2009 monovalent and seasonal influenza vaccinations during the 2009–2010 season in the active component US military and civilians aged 17–44 years reported to the Vaccine Adverse Event Reporting System. Vaccine, 34(37), pp.4406-4414. URL: https://www.ncbi.nlm.nih.gov/pmc/articles/PMC6463880/
Jan 1, 2012 — MEDICAL SURVEILLANCE MONTHLY REPORT. MSMR. A publication of the Armed Forces Health Surveillance Center. MARCH 2012. Volume 19. Number 3. URL: https://www.health.mil/Reference-Center/Reports/2012/01/01/Medical-Surveillance-Monthly-Report-Volume-19-Number-3
Apr 1, 2011 — MEDICAL SURVEILLANCE MONTHLY REPORT. MSMR. A publication of the Armed Forces Health Surveillance Center. MARCH 2012. Volume 18. Number 4. URL: https://health.mil/Reference-Center/Reports/2011/01/01/Medical-Surveillance-Monthly-Report-Volume-18-Number-4
Countermeasures Injury Compensation Program (CICP) URL: https://www.hrsa.gov/cicp
Table 1. Alleged COVID-19 Countermeasure Claims Filed as of [date]
Comparison of Countermeasures Injury Compensation Program (CICP) to the National Vaccine Injury Compensation Program (VICP) URL: https://www.hrsa.gov/cicp/cicp-vicp
Title 42 - Public Health. CHAPTER I - PUBLIC HEALTH SERVICE, DEPARTMENT OF HEALTH AND HUMAN SERVICES. SUBCHAPTER J - VACCINES. PART 110 - COUNTERMEASURES INJURY COMPENSATION PROGRAM. Subpart K—Covered Countermeasures Injury Tables URL: https://www.govinfo.gov/content/pkg/CFR-2016-title42-vol1/xml/CFR-2016-title42-vol1-part110-subpartK.xml
Well done, Nick. Please email me?