

Iatrogenic Guillain-Barre Syndrome (GBS) case rates in the USA
for the periods: i) October, 1 1976 - October, 1, 1977; ii) October, 25, 2009 - October 25, 2010; and iii) December 13, 2020 - December 13, 2021.

For nearly 50 years, US health agencies have known that vaccinations contribute to one of the most common causes of acute neuromuscular paralysis in the world, Guillain-Barré Syndrome (GBS). GBS is typically an iatrogenic injury in which the average cost per patient is over half a million dollars, and pain and suffering are on the order of two to three million dollars. Specifically, after an active surveillance program conducted by the CDC in 1976 following a suspended vaccination campaign for the pandemic swine flu, scientists estimated that ten for every million doses given resulted in GBS. Following the 2009 H1N1 swine flu vaccination campaign the CDC learned that 2.5 cases of GBS resulted in every million doses of vaccination given resulting in GBS within a 42-day period. Finally, CDC committee members published a study that analyzed the vaccine safety data link (VSD) system to report that the Janssen vaccines result in twenty-one cases of GBS per million doses of vaccine given and the mRNA (Pfizer and Moderna) vaccines result in 1.8 cases of GBS per million doses of vaccine given. The H1N1 was administered as an Emergency Use Authorized (EUA) vaccine and was deemed a table vaccine injury in which 24 GBS victims were compensated by the Countermeasures Injury Compensation Program (CICP). A similar table injury should be made for the 244 GBS victims following COVID-19 vaccinations who have petitioned HHS for aid. These victims are only a small fraction of those who have suffered from these countermeasures because they only had one year to petition for help. The Vaccine Adverse Event Reporting System (VAERS) has published 810 reports of GBS following COVID-19 vaccination in the US states. Using the conservative vaccination injury rates from the VSD estimates there are most likely 1.8x(564+68+342+33) 1,812 acute cases of GBS following mRNA vaccinations and 21x31 651 cases of GBS following Janssen vaccinations in the USA. The CDC has never reported on cases of GBS following vaccination for an entire year of monitoring; however, Mike Wallace interviewed nearly ten times as many families of victims who died from GBS following Swine Flu vaccination then the CDC reported. This suggests that the overall case rates of Iatrogenic GBS could be as high as 24,630 in the USA requiring around $12 billion in total medical costs.
Introduction
Guillain-Barré Syndrome (GBS) is the most common cause of acute neuromuscular paralysis in the world. The attack rate of GBS is estimated for adults (18+) to be 12 cases per million person-years with a six percent mortality rate. This attack rate was first estimated after a nationwide active surveillance program for GBS was launched by the CDC on December 2, 1976, because of four cases reported in Minnesota and three cases reported in Alabama after thirty-five million adults had received swine flu vaccines over a nine-week period. By December 15, 1976, it was estimated that ten adults were developing GBS for every million doses administered. By December 16, 1976, the swine flu vaccination campaign was suspended after forty-five million adults had been vaccinated. In spite of the risk of developing GBS following a pandemic-flu strain vaccination, the US vaccinated sixty-three million adults of which around 2.5 adults were expected to develop GBS for every million doses administered within 42 days. Finally, the CDC published a paper showing that the Janssen vaccine should cause around 20 cases of GBS for every million doses administered, and the mRNA (Moderna and Pfizer-BioNTech) vaccines should cause around 1.8 cases of GBS for every million doses administered (3.6 cases of GBS for every million fully vaccinated) within 42 days.
The Janssen vaccine continues to be administered to over 19 million adults by the CDC even though they admit rates of GBS far exceed those seen in the ‘76 Swine flu vaccine. In addition, the CDC continues to vaccinate over 200 million adults with mRNA vaccines even though fully vaccinated adults develop GBS at rates that exceed those who received the H1N1 vaccine. Therefore, from the CDC’s own VSD data, we expect 340 acute cases of GBS following the Janssen vaccines and 720 cases of acute GBS following the mRNA vaccines in fully vaccinated adults within 42 days of administration. For comparison, the H1N1 vaccines should have resulted in 158 adult cases of GBS within 42 days of administration. Yet, this is probably just the tip of the iceberg, as many additional cases of GBS should have resulted following the 76 Swine flu vaccinations as discovered by Mike Wallace.
After seventeen weeks of active surveillance, the CDC found 529 US adults developed GBS following forty-five million doses administered whereas only 436 of the remaining one hundred nine million unvaccinated adults developed GBS during this period. Over a year later, Mike Wallace interviewed three hundred families of those who died with GBS following their swine flu vaccinations, ten times the number of those who were reported dead by the CDC. Therefore, there must have been additional waves of cases of GBS in the vaccinated adults following the seventeen weeks of active surveillance.
However, epidemiologists rarely report case rates following twelve weeks of vaccinations and report on the ratio of total case reports following the first six weeks of vaccination to the second six weeks following vaccination to estimate risk. In spite of the fact that epidemiologists know the relative risk when comparing vaccinated to unvaccinated was two or more for as many as ten weeks following vaccination as reported in the 1976 active surveillance data [2, 5]. As a result, relative risk is understated, for example, the 1976 swine flu vaccine data would suggest a relative risk of 3.45 = (362/105) when comparing the ratio of reported cases (weeks 1-6) to cases (weeks 7-12) to self, whereas when comparing vaccinated to unvaccinated during weeks 1-6 the relative risk is 5.83 = (362/153)x(109/45).
In order to account for the additional waves of GBS that occurs in the vaccinated after seventeen weeks of vaccination, we suggest two types of iatrogenic GBS cases due to vaccination. Acute cases occur within the first six weeks of vaccination and latent cases occur following six to fifty-two weeks post-vaccination. This allows us to estimate the expected number of annual GBS cases for a vaccinated population. For example, using the 1976 swine flu data we would estimate that 5,000 = 362x(52/6)x(45/45)x1.594 vaccinated adults developed GBS over a one-year period. The constant 1.594 equals (300/.06)/(362x(52/6)) in which 300 is the number of those vaccinated who died from GBS and were interviewed by Mike Wallace, six percent (.06) is the GBS mortality rate, there were 362 acute cases in the first six weeks and there are 52 weeks in a year. In addition 436x(52/17) = 1,333 unvaccinated adults would have developed GBS resulting in a total of 6,333 adults (18+) would have developed GBS from 10/1976-10/1977. It’s notable that in 2010, following the H1N1 Swine flu vaccination campaign the CDC claimed for their 2009 H1N1 Accomplishments that “an estimated 3,000 to 6,000 people develop GBS each year on average”.
Iatrogenic GBS Due to Vaccination
Guillain-Barre syndrome (GBS) [1,7]: is the most common cause of acute neuromuscular paralysis in the world, it is a common cause of acute flaccid paralysis, characterized by symmetrical weakness of the limbs, and hyporeflexia or areflexia, which reaches maximum severity within 28 days. Sensory symptoms, such as paraesthesia or numbness, usually start distally and have a symmetrical pattern. Mortality is estimated between 3%-7% in which the 1976 Swine Flu vaccine-induced mortality was 5.9% [2]. A recent systematic review estimated baseline incidence rates to be 1.2 cases per 100,000 person-years. Subtypes of GBS include
Acute inflammatory demyelinating polyneuropathy (AIDP)
Acute motor axonal neuropathy (AMAN)
Miller Fisher syndrome (MFS) is characterized by ophthalmoplegia, ataxia, and areflexia.
GBS typically occurs after an infectious disease in which the immune response generates antibodies that cross-react with gangliosides at nerve membranes. This autoimmune response results in nerve damage or functional blockade of nerve conduction. The most common pathogen causing the antecedent infection is Campylobacter jejuni, which is associated with the AMAN subtype of GBS.
Iatrogenic GBS due to vaccination: GBS that results following one or more vaccinations. The vaccination results in antibodies in the recipient that cross-react with gangliosides at nerve membranes resulting in GBS. Their antibody production may have been triggered by an antecedent infection which was reactivated by the vaccination. Acute vaccine GBS injuries are those which occur within 42 days following vaccination. Acute injuries may include those in which the vaccine-reactivated antecedent infections were either cytomegalovirus, Epstein–Barr virus, Mycoplasma pneumonia, Haemophilus influenzae, or influenza. Latent vaccine GBS injuries are those which occur after 42 days and may include an antecedent infection that triggers the recipient’s antibodies to cross-react with gangliosides at nerve membranes.
For example, the CDC detected 483 acute cases at a rate of 11 cases per million doses administered of the A/New Jersey (Swine flu) vaccine caused GBS injuries and 29 deaths following seventeen weeks of active surveillance; however, somewhere between an additional 517 [3] to 4,528 [4] latent GBS injuries followed. In addition, it is generally accepted that seasonal flu vaccines cause one case of acute GBS injury following one million doses administered [5]. The pandemic strain, influenza A (H1N1) 2009 monovalent vaccine resulted in at least 2.35 acute GBS injuries following one million doses administered in the USA [6]; however, Renata J.M. Engler, MD from the Immunization Healthcare Branch, Defense Health Agency reported 4 acute GBS injuries per million H1N1 doses administered to our active service and coast guard members [7].
Comparing Rates of Iatrogenic GBS resulting from the ‘76 Swine flu to the Janssen vaccines
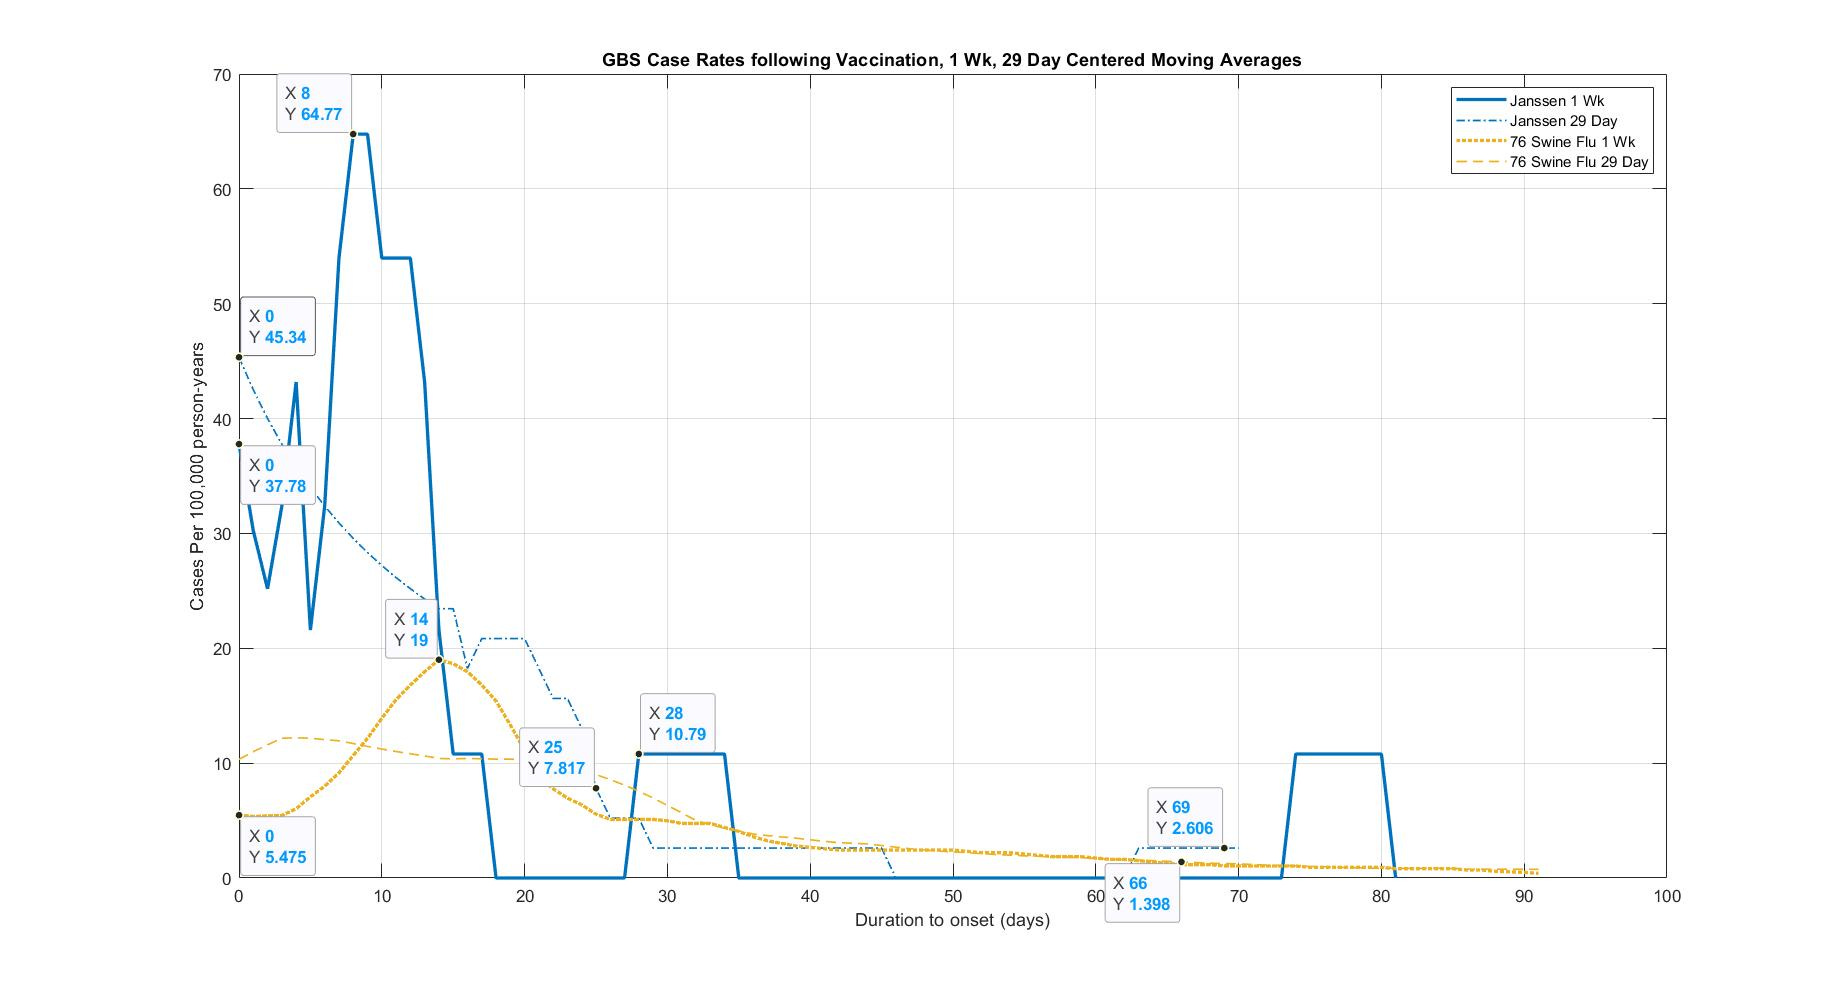
Figure 1 was created from the data provided in [2, Figure 4] for the 1976 Swine Flu vaccine and the data provided in [12, Figure. Timing of GBS Symptom Onset after COVID-19 Vaccination A. Ad 26.COV2.S vaccination]. To calculate incidence rates Per 100,000 person-years we used either a 7-day or 29-day centered moving average of the case data in which 483,053 persons were tracked following the Janssen vaccine and 45 million persons were tracked following the 1976 Swine flu vaccine. As a result, each day of tracked Janssen data from the VSD data set would be considered 1,323.4 (483,053/365) person-years of duration, and each daily reported case would be considered 75.6 cases per 100,000 person-years (100,000/1,323.4). Whereas, the 76 Swine Flu vaccine is less sensitive such that 123,287.7 person-years of duration are covered for every day of tracked data such that each daily reported case would be considered 0.81 cases per 100,000 person-years. Using a 7-day or 29-day centered daily average, in turn, would scale each case rate by (1/7) and (1/29) respectively in order to smooth the data.
The case rates of GBS for the Janssen vaccine far exceed the 76 Swine Flu vaccine in which the peak rate using a 7-day centered average is 64.77 cases per 100,000 person-years on day 8 and the 76 Swine Flu vaccine rate peaks at 19 cases per 100,000 person-years on day 19. Using a 29-day centered average we see the Janssen rates drop smoothly from 45 to 20 cases on day 21 and 2.6 cases per 100,000 person-years from days 28-45 with an additional wave starting on day 63. Using a 29-day centered average we see the 76 Swine Flu vaccine case rate remain around 12 cases per 100,000 until day 25 which continues to decline smoothly to 1.3 cases per 100,000 person-years on day 66 (nearing the US rate of 1.2 cases per 100,000 person-years). Interestingly, only one case of GBS would have been expected during this 12-week monitoring period (4.83x1.2x84/365); however, 11 cases were considered and 11 additional reported cases were excluded.
Comparing Rates of Iatrogenic GBS resulting from the H1N1 flu to the mRNA vaccines
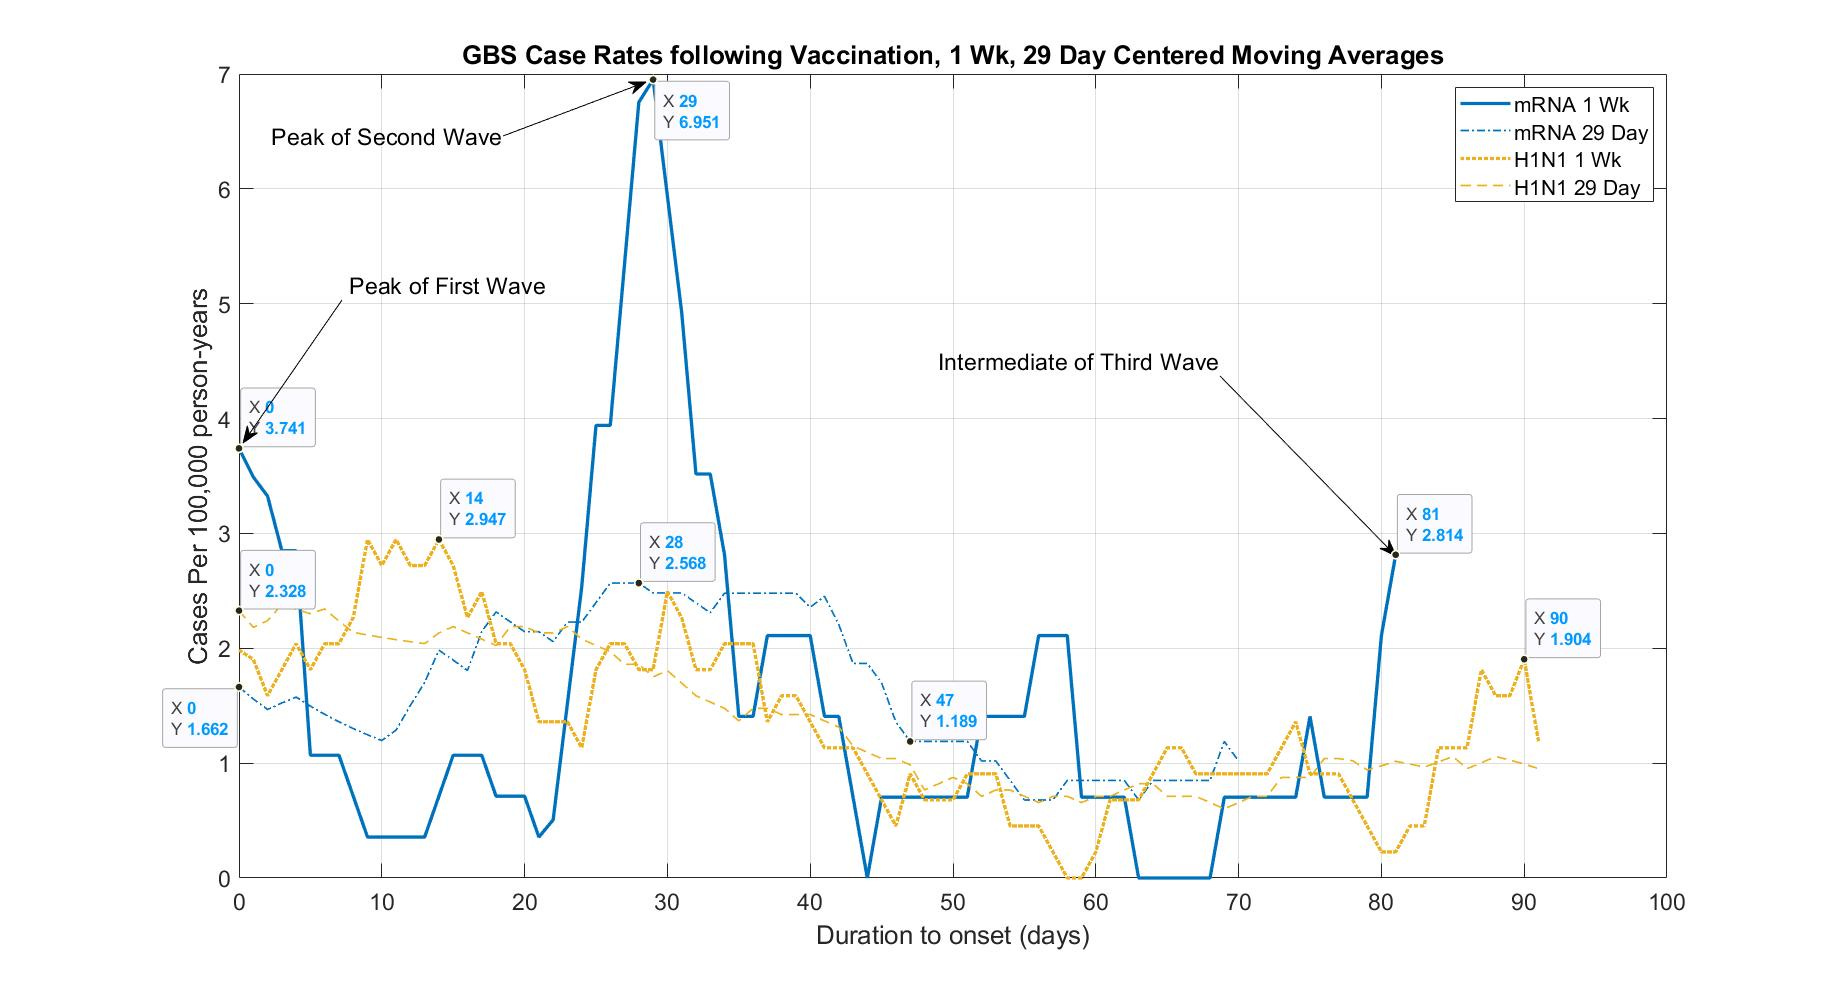
Figure 2 was created from the data provided in [5, Figure 2] for the H1N1 Flu vaccine and the data provided in [12, Figure. Timing of GBS Symptom Onset after COVID-19 Vaccination B. mRNA vaccination]. To calculate incidence rates Per 100,000 person-years we used either a 7-day or 29-day centered moving average of the case data in which 14,637,020 persons were tracked for days 0-21 following the mRNA vaccines (either first or second dose), and 10,289,934 persons were tracked for days 22-28 because 4,347,086 persons had received their second Pfizer dose on day 21, finally, 7,411,936 persons were tracked for days 29-84 because all 7,225,084 adults received their second dose after day 28 whereas 23 million persons were tracked following the H1N1 flu vaccine.
As a result, each day of tracked mRNA data from the VSD data set would be considered 40,101.4 (14,637,020/365) person-years of duration for days 0-21, 28,192 (10,289,934/365) person-years of duration for days 22-28 and 20,306.7 (7,411,936/365) person-years of duration for days 29-84 such that each daily reported case would be considered 2.5 (100,000/40,101.4) cases per 100,000 person-years for days 0-21 and 4.9 (100,000/20,306.7) cases per 100,000 person-years for days 29-84. Whereas, the H1N1 Flu vaccine is less sensitive such that 63,013.7 person-years of duration are covered for every day of tracked data such that each daily reported case would be considered 1.59 cases per 100,000 person-years. Using a 7-day or 29-day centered daily average, in turn, would scale each case rate by (1/7) and (1/29) respectively in order to smooth the data.
The case rates of GBS for the mRNA vaccines meet or exceed the H1N1 vaccine in which the peak rate using a 7-day centered average is 6.951 cases per 100,000 person-years on day 29 and the H1N1 Swine Flu vaccine rate peaks at 2.947 cases per 100,000 person-years on day 14. Using a 29-day centered average we see the mRNA climb from 1.662 smoothly to 2.568 cases per 100,000 person-years on day 28 with a third wave starting on day 70. Using a 29-day centered average we see the H1N1 Swine Flu vaccine case rate remain around 2 cases per 100,000 until day 28 which continues to decline smoothly to 1.019 cases per 100,000 person-years on day 47 (around the US rate of 1.2 cases per 100,000 person-years).
Note that 25 cases of GBS would have been expected during this 15-week monitoring period (74.1x1.2x105/365); however, 36 cases were considered which 42 additional reported cases were excluded including 19 had a prior history of GBS (this exclusion alone will have a significant impact in understating how these cases relate to background rates). Supposedly 13 cases had GBS ruled out; however, what exactly caused these patients’ paralysis if it wasn’t GBS? Among, the authors of [12] who reported and analyzed the VSD data included Dr. Donahue who reported receiving grants from Janssen Vaccines & Prevention Funding for a study unrelated to COVID-19 vaccines outside the submitted work. Dr. Nelson reported nonfinancial support from ACIP/CDC as a member of the COVID-19 Vaccine Safety Technical Subgroup, and grants from Moderna as a member of mRNA-1273 (COVID-19 vaccine candidate) External Safety Advisory Board for Moderna's COVID-19 vaccine program outside the submitted work. Dr. Klein reported receiving grants from Pfizer research support for COVID vaccine clinical trial.
HHS needs to compensate the GBS injured from COVID-19 vaccination in CICP
Our analysis follows directly from the data provided by Dr. Nelson’s paper on the Jannsen and mRNA vaccinations tracked in the CDC-monitored VSD [12]. Dr. Nelson, an ACIP/CDC member of the COVID-19 Vaccine Safety Technical Subgroup, presented an earlier version of this data which the CDC referred to in [10]. It was clear in [10] that the Janssen vaccines were far worse than the 1976 Swine flu vaccine. Many of the reported cases of GBS following the mRNA vaccinations had yet to be reported; however, the data in [12] shows that when compared to the H1N1 data set it is clear that the mRNA vaccinations are responsible for acute GBS injuries. An average GBS injury will burden the victim and their families with around half a million dollars in direct medical and indirect costs [9], and sometimes death in 6% of the cases. At the very least, HHS should pay those GBS injured who filed a claim within one year to CICP around half a million dollars as a table injury such as those injured with GBS following H1N1 vaccination [4].
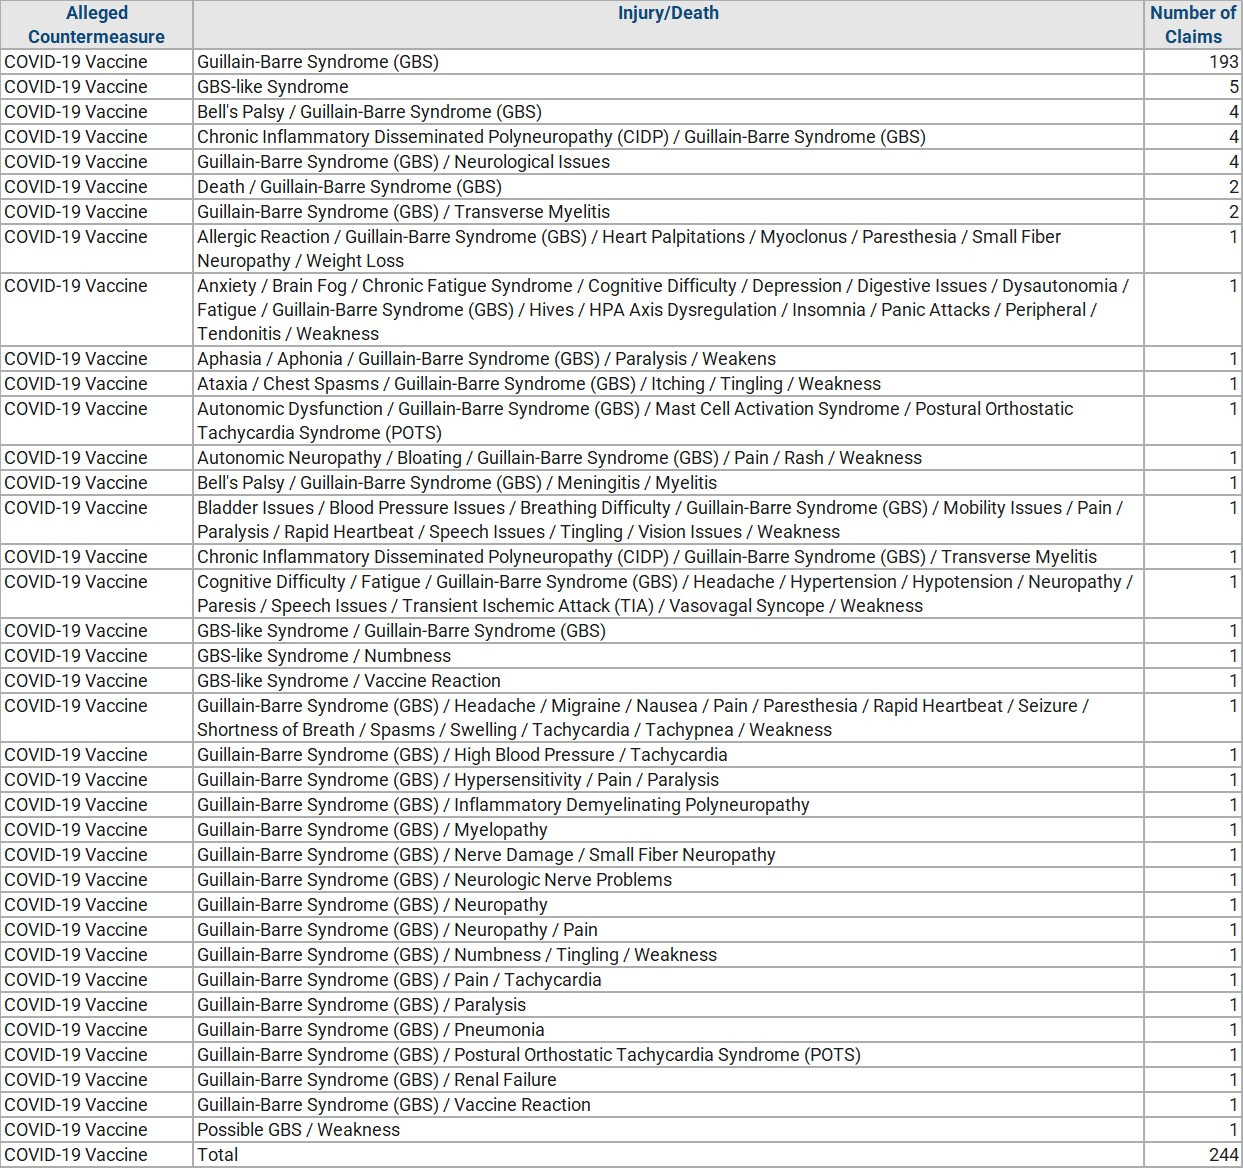
As Table 1 shows the CICP data lists 244 submitted claims for compensation involving GBS in which one claim has already been denied. Roughly 383 million doses of COVID-19 vaccines were given to 200 million fully vaccinated adults. For comparison, the CICP compensated 24 claims of GBS following 54 million H1N1 vaccinations of adult Americans [13]. The ratio of COVID-19 claims of GBS per vaccination dose to H1N1 vaccination dose for US adults (18+) is (244/383):(24/54) = 1.4:1 so it seems all the more evident that HHS should make GBS a table injury. Finally, the reported cases of GBS following COVID-19 vaccinations are impossible to ignore.
112 reports of GBS have been published in VAERS following H1N1 vaccinations. Whereas 810 reports of GBS have been published in VAERS as of 2022-11-25 following COVID-19 vaccinations in which 207 injuries followed a Janssen vaccination, 603 following mRNA vaccinations consisting of 292 Moderna and 380 Pfizer-associated injuries. These rates of reporting are well above those compared to seasonal flu vaccinations which are also considered table injuries by the CDC and assumed to occur at a rate of one per million vaccinations as indicated in Table 2. For example, only 218 cases of GBS were reported from 2017-11 thru 2022-11 following seasonal influenza vaccinations (44 reports per year with over 160 million flu doses given annually). As discussed in our introduction, there are a vastly greater number of annual cases of GBS caused by these vaccines; however, except for the reporting of Mike Wallace in 1976, little has been done to study the rates of GBS for durations exceeding 12 weeks. It is imperative for Congress to fully understand the impact of the damage being done by these vaccines over years and not weeks in order for the US to develop safer interventions as the CDC drives such high levels of mass vaccinations.

References:
Van den Berg, B., Walgaard, C., Drenthen, J., Fokke, C., Jacobs, B.C. and Van Doorn, P.A., 2014. Guillain–Barré syndrome: pathogenesis, diagnosis, treatment and prognosis. Nature Reviews Neurology, 10(8), pp.469-482. URL: https://www.nature.com/articles/nrneurol.2014.121
Schonberger, L.B., Bregman, D.J., Sullivan-Bolyai, J.Z., Keenlyside, R.A., Ziegler, D.W., Retailliau, H.F., Eddins, D.L. and Bryan, J.A., 1979. Guillain-Barré syndrome following vaccination in the national influenza immunization program, United States, 1976–1977. American journal of epidemiology, 110(2), pp.105-123. URL: https://academic.oup.com/aje/article-abstract/110/2/105/57614
Kuwabara, S., Misawa, S. and Mori, M., 2013. Guillain–Barré syndrome and influenza A (H 1 N 1) 2009 monovalent inactivated vaccines: The risks and benefits. Clinical and Experimental Neuroimmunology, 4(3), pp.249-250. URL: https://onlinelibrary.wiley.com/doi/abs/10.1111/cen3.12065
Kottenstette, N. 2022. How Does The MIL-VAX Agency Detect GBS? URL:
Willison, H.J., Jacobs, B.C. and van Doorn, P.A., 2016. Guillain-barre syndrome. The Lancet, 388(10045), pp.717-727. URL: https://www.thelancet.com/action/showPdf?pii=S0140-6736%2816%2900339-1
Salmon, D.A., Proschan, M., Forshee, R., Gargiullo, P., Bleser, W., Burwen, D.R., Cunningham, F., Garman, P., Greene, S.K., Lee, G.M. and Vellozzi, C., 2013. Association between Guillain-Barré syndrome and influenza A (H1N1) 2009 monovalent inactivated vaccines in the USA: a meta-analysis. The Lancet, 381(9876), pp.1461-1468. URL: https://pubmed.ncbi.nlm.nih.gov/23498095/
Bardenheier, B.H., Duderstadt, S.K., Engler, R.J. and McNeil, M.M., 2016. Adverse events following pandemic influenza A (H1N1) 2009 monovalent and seasonal influenza vaccinations during the 2009–2010 season in the active component US military and civilians aged 17–44 years reported to the Vaccine Adverse Event Reporting System. Vaccine, 34(37), pp.4406-4414. URL: https://www.ncbi.nlm.nih.gov/pmc/articles/PMC6463880/
Military Vaccine (MILVAX) Agency, Alexandria, VA: Garman, P., Rigo, M., 2012. Predictive Value of Surveillance Case Definitions of Guillain-Barré Syndrome in Vaccine Safety Assessment, Jan 1, 2012. MEDICAL SURVEILLANCE MONTHLY REPORT. MSMR. A publication of the Armed Forces Health Surveillance Center. MARCH 2012. 19(3), pp.8-9. URL: https://www.health.mil/Reference-Center/Reports/2012/01/01/Medical-Surveillance-Monthly-Report-Volume-19-Number-3
Pittman, G.L., 2009. Economic cost of Guillain-Barré syndrome in the United States. Neurology, 72(14), pp.1282-1282. URL: https://n.neurology.org/content/71/1/21
"This study estimated the annual economic cost of Guillain-Barré syndrome (GBS) in the United States in 2004, including the direct costs of medical care and the indirect costs due to lost productivity and premature death. The estimated annual cost of GBS was $1.7 billion [$2.7 billion in 2022 dollars] (95% CI, $1.6 to 1.9 billion), including $0.2 billion (14%) in direct medical costs and $1.5 billion (86%) in indirect costs. Most of the medical costs were for community hospital admissions. Most of the indirect costs were due to premature deaths. The mean cost per patient with GBS was $318,966 (95% CI, $278,378 to $359,554) [an average cost of $500,275.12 in 2022 dollars]." [$1.7 billion/$318,966 = 5,329 annual cases in need of care in 2004]
Rosenblum, H.G., Hadler, S.C., Moulia, D., Shimabukuro, T.T., Su, J.R., Tepper, N.K., Ess, K.C., Woo, E.J., Mba-Jonas, A., Alimchandani, M. and Nair, N., 2021. Use of COVID-19 vaccines after reports of adverse events among adult recipients of Janssen (Johnson & Johnson) and mRNA COVID-19 vaccines (Pfizer-BioNTech and Moderna): update from the Advisory Committee on Immunization Practices—United States, July 2021. Morbidity and Mortality Weekly Report, 70(32), p.1094. URL: https://www.cdc.gov/mmwr/volumes/70/wr/mm7032e4.htm#T1_down
Sejvar, J.J., Baughman, A.L., Wise, M. and Morgan, O.W., 2011. Population incidence of Guillain-Barré syndrome: a systematic review and meta-analysis. Neuroepidemiology, 36(2), pp.123-133. URL:https://www.karger.com/Article/PDF/324710
Hanson, K.E., Goddard, K., Lewis, N., Fireman, B., Myers, T.R., Bakshi, N., Weintraub, E., Donahue, J.G., Nelson, J.C., Xu, S. and Glanz, J.M., 2022. Incidence of Guillain-Barré Syndrome After COVID-19 Vaccination in the Vaccine Safety Datalink. JAMA network open, 5(4), pp.e228879-e228879.
Borse, R.H., Shrestha, S.S., Fiore, A.E., Atkins, C.Y., Singleton, J.A., Furlow, C. and Meltzer, M.I., 2013. Effects of vaccine program against pandemic influenza A (H1N1) virus, United States, 2009–2010. Emerging infectious diseases, 19(3), p.439. URL: https://www.ncbi.nlm.nih.gov/pmc/articles/PMC3647645/
Wonderful analysis. GBS has long been an injury from several vaccines on the NVICP table, yet prominently dismissed by public health officials. Now, it is one of the leading injuries filed in the CICP. Medical officials ignored the lessons of the 1976 Swine Flu Fiasco and continue today.